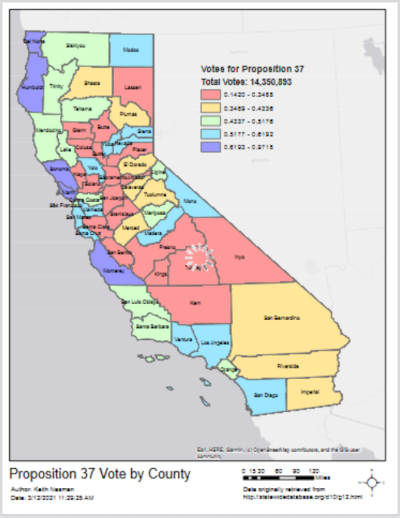
I am taking the Geographical Information Systems(GIS) course from UC - Davis offered through Coursera. The assignment for the Fundamentals of GIS is based on California's 2012 proposition 37 which would have mandated labeling of genetically modified organisms(GMO) in food. It did not pass. The mission is to take the voting precinct data and to graphically display the results by county to assist in the analysis of where the proposition had support and where it didn't.
We were given the voting precinct data and the California counties feature data. Since the precinct data included the area shapes of the precincts I was able to use a spatial join of the precinct data and the counties. Then I used the symbology to show the votes by county to highlight where the votes were groups. The rest of the assignment dealt with creating a proper map with a legend, north arrow, sources, etc. One thing I learned just after this assignment was how to change the labels on the symbology so that I could have showed the legend with actual percentages. The layer properties in ArcMap is like a whole program in itself with all the embedded complexity.
- Keith